I can only be described as a fair-weather cyclist. When it rains, I’m scared I might shrink and immediately I resort to driving. However, the cold never worries me. That’s what heaps of cold weather gear is for. Recently my son, Johnny, purchased a cross country e-bike. A ride up the street scared the life out of me. I’m more of a casual e-biker. In the first year of owning one I covered around 2500kms. That would have mostly been in a car before.
I was cycling around Christchurch last week and it seemed to me that there seemed a lot of people out on bikes. At one traffic light the whole front of the lane waiting for a change to green was completely bike riders. The cars were behind. This is brilliant. Here’s a photo of one traffic light:

Here’s a link to viewing the data collected each day on cycle movements in Christchurch. It’s well worth looking at a marvelling at the number of movements on cycles there are https://smartview.ccc.govt.nz/#map/layer/ecocounter/@172.63215,-43.50161,12

I checked out with the official Tuesday Club cycle expert, Axel Downard-Wilke , enquiring whether or not my observation was accurate. He confirmed my eyeball statistics were correct. He replied:
We’ve had double-digit growth for a few years now (and are growing significantly faster than the other big cities in NZ; CCC certainly is doing something right in this space!) and in the last year, it was nearly 20% growth. There’s now a reasonably dense network of permanent counters, so this isn’t about anecdotes but we are dealing in facts.
Axel referred me to an article he published in February:
In July 2017, the NZ Transport Agency published Research Report 621 (Regulations and safety for electric bicycles and other low-powered vehicles).
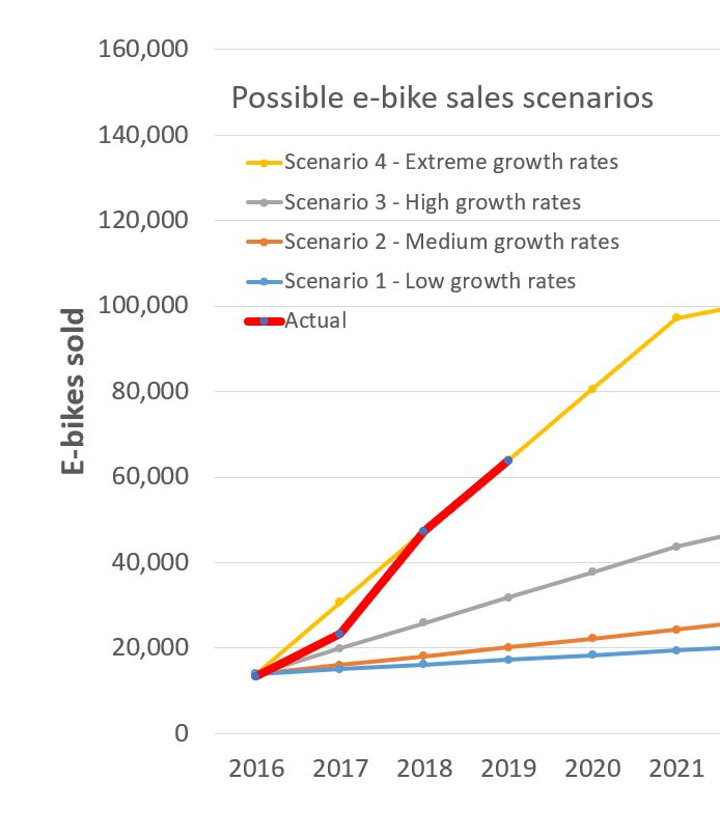
As part of that, we predicted e-bike sales in New Zealand based on what had been happening up until 2016 in New Zealand and Europe. Four future scenarios were used for our predictions (low to extreme growth) and with the 2019 data now available from Stats NZ (warning – the extraction of data is complex!), we thought we would have a look how actual data track against our predictions.

The above graph shows actual data overlaid onto Figure 4.6 from the 2017 research report. There are a bunch of caveats. Customs NZ changed the classification codes in 2017 (see codes 8711.60 and 8711.90 of the tariff document) and it’s somewhat murky what exactly gets counted. Customs has advised us that it is likely that e-scooters are being included, and make up about 40% of the sales. So, e-bikes are probably tracking around the “High growth” line. Another way to try and gauge the growth of e-bikes is through observational surveys – we’ve done a few but are working on getting a project off the ground that will focus on the speed and gender of people riding un-assisted & electric assist bicycles.
It was interesting to read this article in the Guardian recently about e-cycling https://www.theguardian.com/business/2020/sep/08/electric-bike-and-scooter-sales-boom-pushes-halford-back-to-growth-covid-19
Leave a Reply